According to a study by the ASHP, Non-Federal U.S. Hospitals had a drug spend of 39.6 billion in 2021, representing an 8.4% increase compared to 2010. Unfortunately, this trend of high volumes driving high expenditure is consistent across injectables, non-injectables, branded, and generic products.
Facing increase expenditures across the board, it is no wonder that 50% of the responders in the just-released 2022 Hospital Pharmacy Operations Report said that reducing drug spend was their #1 initiative for 2022. Moreover, 23% of responders stated that increasing operational efficiency was their top initiative.
Unfortunately, increasing operational efficiency and reducing drug spend often feels like an “either or” situation. Put another way, it is difficult to optimize for both staff person-hours and total drug spend. Either your buyers can move quickly, or they can search for every potential savings.
Fortunately, unlike humans, computers and software are able to quickly and efficiently comb large datasets for specific pieces of information. In the case of hospital drug spending, that means finding the 1) cheapest, 2) in-stock drug that is available across the multitude of contracts available.
CostCheck is a versatile Drug Purchasing Optimization tool which enables pharmacy buyers by providing real-time insights into drug pricing, GPO compliance, and 340B optimization. Today, Costcheck’s optimization engine only considers the contracts available to a hospital via their primary wholesaler. As 90+% of a hospital’s spend is through their primary wholesaler, this optimization results in substantial savings.
Still, what if CostCheck were able to optimize across both primary and secondary wholesalers? Or wholesalers and direct channels? Would there be additional savings? Would there be meaningful efficiency gains?
In conversation with members of the Bluesight Community, we know that most pharmacy buyers only deviate from their primary wholesaler when their primary is out of stock. Simply put, there simply isn’t enough time to verify that the primary wholesaler is the cheapest source of a given medication. But what if there were enough time?
The following data analysis is an experiment we performed with real historical data from one of our partner Hospitals.
Historical Catalog Data
We analyzed historical catalogs and invoices for our partners’ primary wholesaler and secondary wholesaler. In Q1 2023, our partner purchased 1,776 unique NDCs. 1727 unique NDCs were purchased via their primary wholesaler, and 152 via their secondary. A total of 103 NDCs were purchased via both wholesalers. That is, at some point in the year the hospital purchased the NDC via primary wholesaler, and at another point they purchased the same NDc from their secondary..
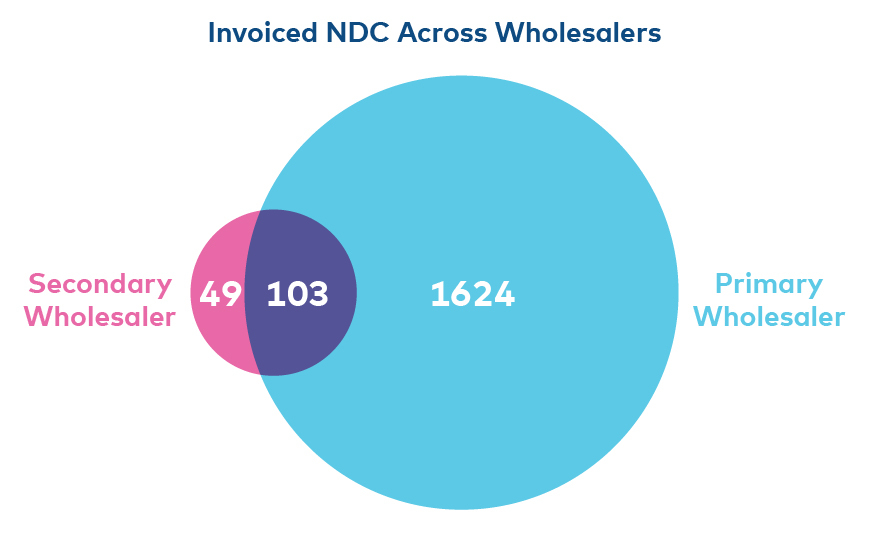
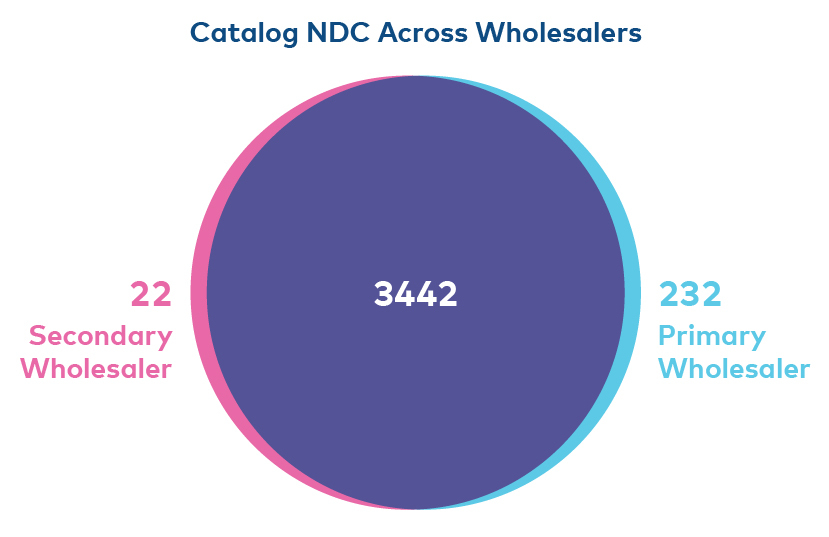
Interestingly, over 90% of the NDCs purchased by our hospital in Q1 of 2023 can be found in both wholesalers’ catalogs.
From speaking with our Partner, we know that due to contractual obligations, our partner only deviates from their primary wholesaler when the NDC in question is out of stock. Yet with such an overlap in catalog, we wondered what our partner would have saved if they had been able to optimize across both channels.
The next step in our research was to unify the historical catalog prices and historical invoices. Our hypothesis was that there were instances where our partner purchased an NDC from their primary wholesaler even though the medication was more cheaply available via their secondary wholesaler.
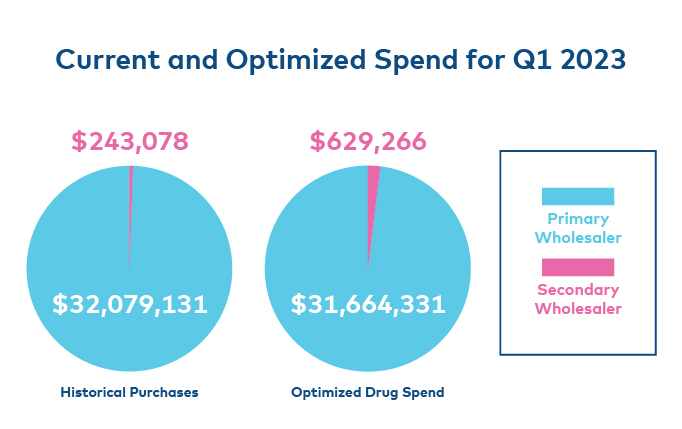
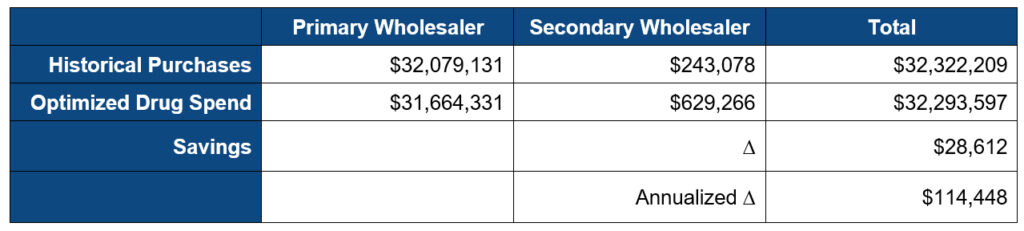
Our partner, representing 8 hospitals, spent $32,322,209 in Q1 of 2023, 99.2% ($32.1M) via primary wholesaler, and 0.8% ($243K) via their secondary wholesaler..
By optimizing across both channels, we were able to identify numerous instances where our partner purchased an NDC via their primary wholesaler, even though it was cheaper through their secondary. In fact, the “optimized procurement strategy” (OPS) would have increased the secondary wholesaler total drug spend by over 150% to $630K. Conversely, the OPS decreased their primary spend by over 1% ($31.6M).
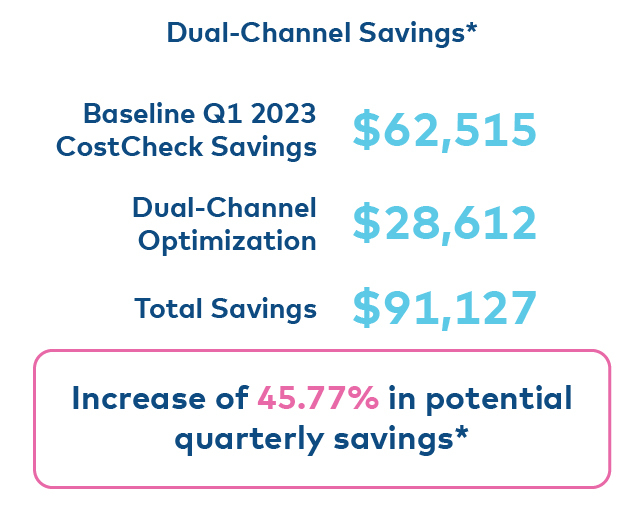
All told, the OPS would have saved the hospital $28,612 for an annualized savings of $114,447.
To put this in context, CostCheck today – by optimizing medication procurement across a hospital’s primary wholesaler saves that hospital, on average, 1-3% of their total drug spend.
In Q1 of 2023, CostCheck saved our partner $62,515. If they had been able to optimize across both their primary and secondary wholesalers, they would have saved an additional $28,612 representing a 45% increase!
We believe that software has a great opportunity to help pharmacists and hospitals reduce drug spend AND increase operational efficiency. Even our exercise here leaves much left to be explored and optimized.
As a quick example, CostCheck today not only optimizes for an NDC – but for an entire therapeutic equivalent group – optimizing for clinical use, not accounting. Yet, for this exercise, we only took NDC into consideration. In fact, we didn’t even explore different packaging options.
Why is this a good thing? Because it means that the 45% increase only represents the floor of what is possible. The crux of the opportunity, however, is the ability to quickly consider all available inventory via all available sources. Until hospitals are able to do so in an efficient manner, they will be unable to optimize procurement and reduce drug spend.