But we really have to look at a lot more data to get a clear, full picture of the indicators of diversion.
Location Data Can Reveal Diversion Patterns That are Otherwise Missed
In the course of reviewing reams of data while developing and refining Bluesight for Controlled Substances, we found that location can be a significant factor in identifying outlier behavior. The User Mobility dashboard in Bluesight for Controlled Substances was created to take a closer look at the “Where” diversion is occurring. It helps zero in on locations of greater risk, giving you more clarity into where to focus your investigations.
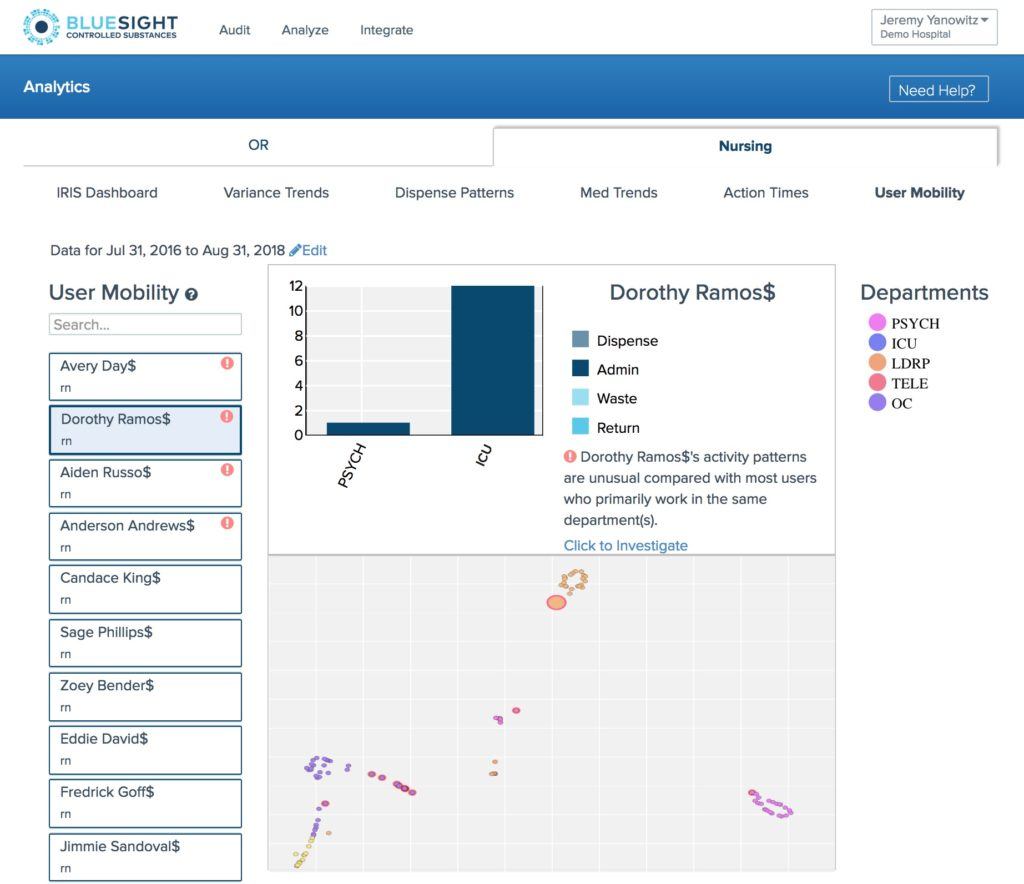
Example data
Behavior Patterns Match Who, What and Where
Bluesight for Controlled Substances does this by highlighting location-related patterns for specific users, both within and across departments. We know, of course, that it is often completely normal for certain users to work in different parts of the hospital—for example, clinicians that follow their patients from the ICU to recovery, or nurses on a floating rotation. But how can you determine when users are moving in non-standard ways or to areas that are not required for normal course of patient care?
We start out by identifying the normal pattern of users who primarily work in a given department. The User Mobility dashboard then highlights users whose patterns differ significantly from that of other users who work in the same department(s). Users are sorted within the report by how unusual their movement patterns are compared to their peers. User activity that happens in a lower-volume area may also be flagged.
If a user works primarily in PACU, for example, but also records activity in Maternity, he or she may be highlighted as an outlier and an individual worthy of a closer look. The report allows you to drill down into the data to see the specific reasons a user is highlighted for behaving differently—for example, patient record, dispensed and administered or other transactions.
In addition, the User Mobility dashboard also pinpoints who has access to what areas, and what types of transactions are being documented in each department. This allows for even tighter focus into users’ behavior.
Machine Learning Makes This Possible
There is a reason you haven’t had this information in the past. The technology wasn’t readily available and the algorithms for doing this type of work weren’t developed. But that has changed. Kit Check’s data science and clinical professionals collaborated to build new algorithms driven by machine learning that reveal subtle differences in behavior. The results suggest location can be an important signal of diversion that is often overlooked. That is the genesis behind the Mobility Dashboard that is available today to all Bluesight for Controlled Substances users.
Data Reveals Even More When We Combine Other Factors
So we have three Ws—the What, the Who, and the Where—covered under the Mobility Dashboard. Bluesight for Controlled Substances can also help you see the When and the How, which we will discuss in the coming weeks. Unfortunately, the final W—the Why—is a much more difficult question to answer. It is up to us as medical professionals to work together on this one.
If you’d like to see Bluesight for Controlled Substances and the User Mobility report in action, please contact us to schedule a demonstration.