You asked and we listened! The ControlCheck Benchmarking and User Activity Dashboard is now available to all customers.
Hospitals and health systems across the country previously expressed interest in benchmarking data to see how their key performance indicators (KPIs) compare to the national average. In the past, this benchmarking information was manually pulled by the ControlCheck team and put into excel reports that could be difficult to digest.
The ControlCheck Benchmarking Dashboard, now available to all customers, provides the same key information as the previous reports, and now includes historical trending data as well as user activity data. With the new dashboard, hospitals will be able to benchmark against other hospitals of similar size. The hospital benchmarking data is refreshed on a monthly basis. The dashboard includes graphs and tables that are ready for your executive team to review. ControlCheck hospitals can now easily see their progression over time on key performance metrics and quickly identify opportunities for improvement.
Benchmarking metrics include (but not limited to):
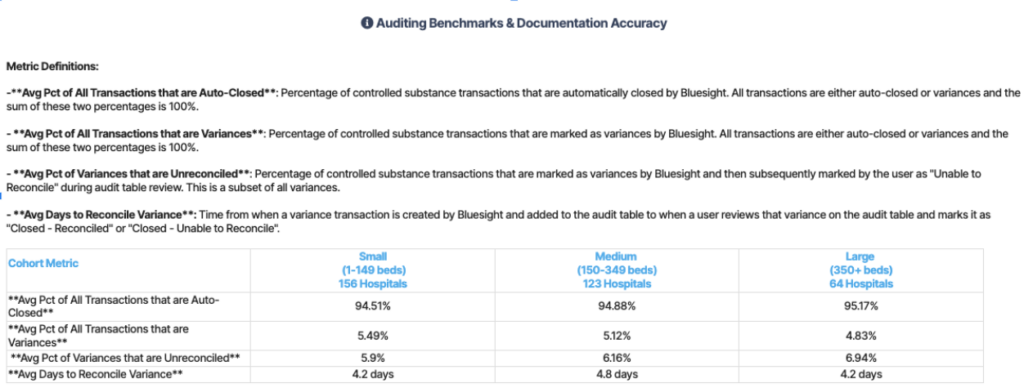
- Average percentage of variances
- Average percentage of unreconciled variances
- Average days to reconcile variances
- Average controlled substance actions per user and department
- Average number of investigations completed
- Average days to close an investigation
- Average percent of investigations closed as “non-diversion”
- Average percent of investigations opened for reasons other than “routine surveillance”
The Dashboard further provides insight into user activity within ControlCheck on a hospital basis. Now, leadership has visibility into who is logging into the application, how often, and what they are doing within the system to help monitor and encourage engagement. Leadership will now be able to determine which users and departments are engaging the most with the software. This will help nursing and pharmacy leadership easily monitor compliance with controlled substance diversion monitoring policies including frequency of monitoring, opening investigations, and auditing open variances.
User activity is updated in real-time and metrics include (but not limited to):
- Active users
- Inactive users
- Active users of the audit table
- Active user of IRIS analytics across
- Users who opened an investigation
- Average time spent in ControlCheck per week
- Total number of notes added to event summaries across the last 30 days by user
- Total time spent in ControlCheck across the last 30 days per user
Your Account Manager will be sharing the dashboard proactively with the key points of contact at each facility. Once access has been provided, these key points of contact will have access to share the dashboard with anyone else in their organization. Please reach out to your Bluesight Account Manager with any questions regarding the ControlCheck Benchmarking and User Activity Dashboard or with any questions regarding access.